
Your Shopping Cart is empty.
Results (5)
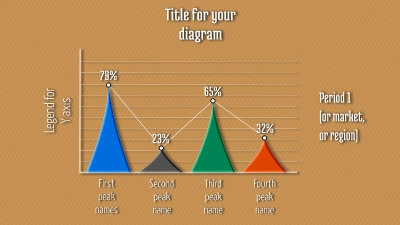
Spike diagram
Customisable two periods comparison diagram. Great for explainers and infographic videos.

Arrows Flowchart
A flowchart with six arrows connected slides. Can also be used as an action plan or workflow description. Background color can be changed to match any corporate one.
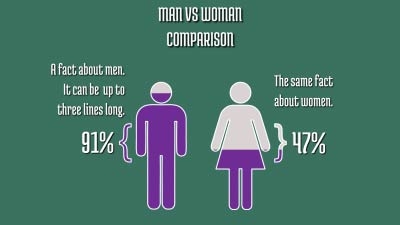
Men vs women
A customisable infographic clip showing difference between men and women in relation to any given topic. Ideal for video presentations.
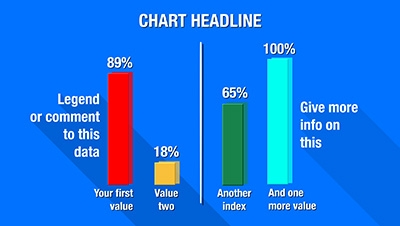
Double bar charts
Customisable bar charts for explainers or infographic video. Name your bar charts and add their values. Adjustable colors.
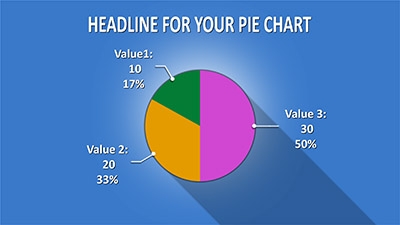
Pie chart - 3 segments
Pie chart with three segments. Excellent for use within your infographic video or presentation. Segments and percentages will automatically match your submitted values.